
When I asked my readers if there was a topic they wanted me to write a blog post about, Carlos urged me to explain how to know if the stock market is under- or overvalued. I'm guessing more people are interested in knowing the answer to this, so here it is.
As a value investor you are constantly looking for undervalued stocks, or in other words stocks which trade at a price below their intrinsic value. But is it possible to determine whether the stock market as a whole is under- or overvalued? Sure! This is definitely possible, and there are several ways to approach this.
1. P/E RATIO
The first metric we could use to determine the valuation of the overall stock market is the price/earnings ratio (P/E ratio).
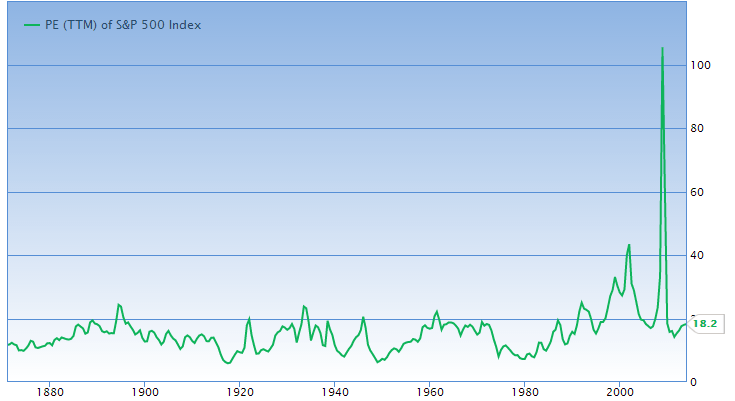
The above chart shows the P/E ratio of the S&P500 index since 1880. As you can see, the P/E has mostly stayed between about 7 and 22, while it is currently around 18. So the market valuation is currently on the higher side of the range and therefore we could say that the overall market is not undervalued at this moment in time.
So what's up with the massive spike which occurs in the chart around 2008? Well, this is because large companies suddenly did not make any money and some even reported significant losses. This inflated the P/E ratio until the sharp price decline which followed sort of normalized the situation again.
2. Shiller P/E
The second metric we'll look at is the so called Shiller P/E.
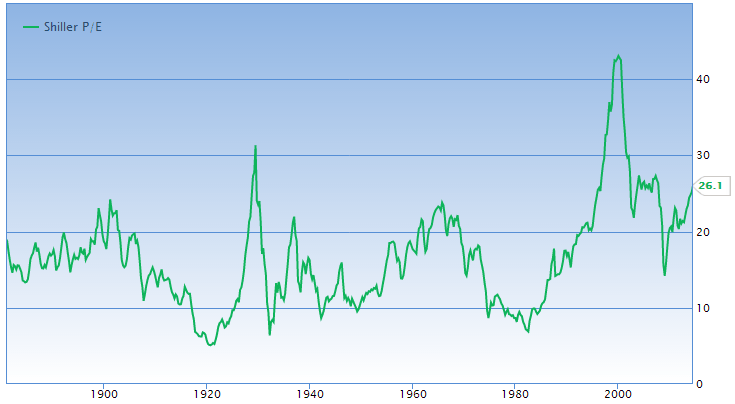
This metric smooths out the P/E ratio by averaging inflation-adjusted earnings over the last 10 years. The Shiller P/E ratio was devised by Robert Shiller, Sterling Professor of Economics at Yale University and author of the bestseller Irrational Exuberance. Looking at the chart above we see that the only time it has been higher than today has been on Black Tuesday before the Great Depression started, in 1999 just before the Tech Bubble burst, and in 2007 before the financial crisis hit the markets like a sledge hammer. So based on this info we could say the overall market is currently nearing its peak.
3. Dividend Yield
Another way to determine whether the stock market is over- or undervalued is by looking at the dividend yield.
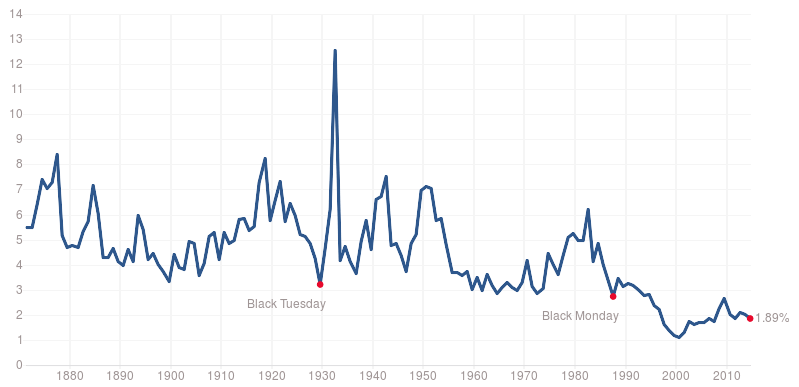
Generally speaking, when stocks are cheap, dividend yields are high. Simple. However, if we look at the above chart, we see that the only time since 1880 that dividend yields were lower than today was at the peak of the Tech Bubble when prices were massively inflated. The dividend yield of the S&P500 has mostly stayed between 7% and 3%, but today the yield is a mere 1.89%. Not a good sign…
4. Interest Rates
Interest rates are an often discussed topic amongst investors. I'd even go as far as saying that it's a too often discussed topic. The reason is clear though: the entire financial market is affected by them.

Interest rates are important, because they determine, amongst other things, the return investors get on government bonds. Government bonds are, in theory at least, the most secure way to invest your money, since the government guarantees your returns. Therefore, the yield on government bonds is sometimes referred to as the risk-free rate. If bonds yield more than stocks, investors will naturally put their money in the risk-free bonds instead of in volatile stocks, therefore creating less demand for stocks which inevitably results in lower stock prices.
To give you a simplified example, assume that government bonds yield 3%. A certain stock, on the other hand, is priced at $10 per share and has $1 earnings per share. Therefore, the stock yields 10% ($1/$10), which is more than the 3% you get on the bond. This creates demand for the stock and pushes its price up to, let's say, $20 per share. The stock now yield just 5% ($1/$20). If interest rates are suddenly increased from 3% to 6%, which is higher than the yield of the stock, this stock is suddenly not so attractive anymore and investor's money will flow from stocks to bonds, therefore pushing stock prices down.
Today, interest rates are at the lowest point they have ever been in order to stimulate the economy. This has pushed stock prices higher. You could even say that it has artificially inflated stock prices. Sure, some of the price increases can be explained by increased earnings -- companies are earning more today than they were in 1990 for example -- but from a valuation standpoint stocks are currently rather expensive. Low interest rates lead to high P/E ratios.
5. Market Cap to GDP
This final metric is Buffett's personal favorite! He said that the Market Cap to GDP ratio is "…probably the best single measure of where valuations stand at any given moment."
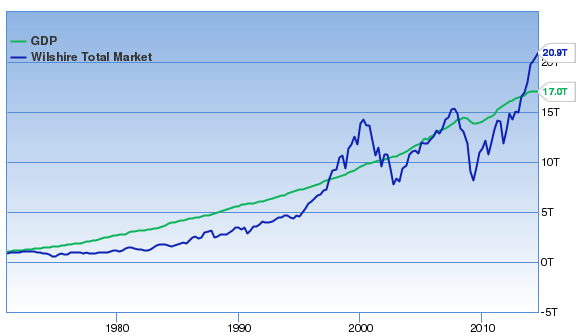
The above chart shows the Gross Domestic Product (GDP) versus the market cap of the total stock market. The idea is that when the market cap is higher than GDP, the stock market is overvalued. If the market cap is below the GDP, the stock market is undervalued. As you can see from the chart, the two times the market cap was above the GDP was just before the Tech Bubble and before the financial crisis. Oh, and the third time is right now!
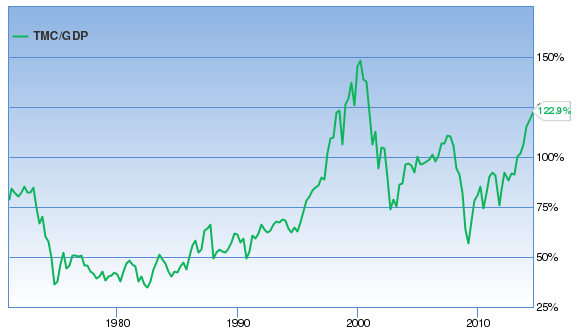
Another way to look at this metric is by taking a percentage view, as the above chart shows. 100% is when the overall market cap equals GDP. We are currently at 122%, indicating a 22% overvaluation relative to GDP. Again, not good.
Closing Thoughts
In this article I've shown you five ways to know if the overall stock market is over- or undervalued. All of these metrics indicate that the stock market is currently overvalued. But does this mean that you should not invest today? Not at all! You are not buying the entire market, you are buying individual stocks. And while the overall market may be overvalued right now, it can still be possible to find individual stocks which are significantly undervalued. Sure, it's a bit harder to find them during these times, but they are out there! Besides, you can never know when the market has hit its absolute peak. It might continue to rise for months despite its current overvaluation.
Still, it might be a smart move to keep a part of your portfolio in cash during times like these to make sure you are ready to dive in once prices start dropping. I would also recommend to take a profit by selling any overvalued stocks you are currently holding in your portfolio, because the high-flyers will be the first to crash.
If you enjoyed this article, I would really appreciate it if you'd share the love by clicking one of the social media buttons. Thanks, and have a great day!


FREE SPREADSHEETS & EBOOK
Get three powerful automated spreadsheets, including an intrinsic value spreadsheet + my ebook "The 10 Best Investors in the World", for free!