I will be honest with you, there are many amazing investing tools out there. However, the usual approach seems to be to bombard you with mountains of financial data, ratios you have never heard of, and unnecessarily complex valuation metrics.
We humans are information junkies, and having access to so much data, especially data which is so complex you hardly understand it, can give you the feeling of knowing more than someone else and thus allowing you to make better investment decisions, but this really is an illusion.
In fact, this information overload over-complicates the decision making process, which in turn can lead to the unfortunately all too common state of analysis paralysis. In addition, it allows you to cherry pick the indicators that support your initial thesis while ignoring the rest, which is a clear warning sign for confirmation bias.
All investors really need to make informed investment decisions is an answer to the two most essential questions in investing:
1. How well is this company performing?
2. How much is this company worth?
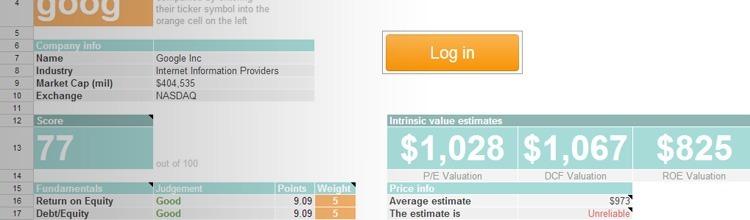
Answering these two key questions and showing the results in a clear overview to investors, allowing them to make quick and informed decisions, is exactly the approach I took with my Premium Value Spreadsheet, and the Dashboard plays a vital role in this. Let us now take a detailed look at the heart of Value Spreadsheet, the Dashboard.
Log in

The first thing you'll want to do when you open the spreadsheet is fill in your email address (the same one you used to purchase the spreadsheet), which will log you in so you can start using the spreadsheet.
You'll only have to do this once, the very first time you use the spreadsheet, after you've made a copy of the original using File > Make a Copy in the top menu.
If you experience any issues with logging in, please send an email to
Ticker input field

Now that you are successfully logged in we can start with the fun stuff: analyzing stocks! The orange Ticker field allows you to fill in the ticker symbol of a company you would like to analyze. This is literally the only field you will have to fill in.
Type in a ticker, press ENTER and the spreadsheet does the rest! Easy. All relevant financial data of the company you entered will now automatically be retrieved from my premium financial data feed and pulled into the spreadsheet, ready for analysis. My data provider updates their data within 24 hours after earnings are released, so you always have up-to-date data at your disposal.
At this point in time it is possible to analyze stocks from the US, Canada, Australia, UK, Germany, Netherlands, France, Singapore, Hong Kong, and India, excluding ETFs, options and financial stocks.
Fundamental score

The beauty of Value Spreadsheet is that while it performs several complex calculations and analyses, you do not have to be a chartered accountant to be able to use it.
The fundamental score shown on the Dashboard is a unique method I used to simplify the process of analyzing stocks. It is essentially a summary score of all the fundamental indicators used by the spreadsheet to assess the financial health of a company. In other words, this score answers the first essential question of investing: how well is this company performing?
It is a score between 0 and 100, and a high score indicates that a company is performing well and is in good financial condition. So a high score is what you should be looking for.
But what is considered to be a high score?
It is safe to say that companies which score 80 or higher are in above average financial condition. However, this is not an absolute threshold. A company which scores 70 can also be a perfectly sound investment as long as you do your due diligence. To find more in depth information on why a certain indicator is considered good or bad, click on the Analysis tab on the bottom of the spreadsheet to view an explanation per indicator.
Weights
Because all investors have their own unique strategy, even though the underlying beliefs of buying great companies at discount prices might be the same, I implemented a flexible scoring system which allows investors to tweak it in such a way that it matches their own strategy as closely as possible.
This is where the Weights come into play.
So how does this work?
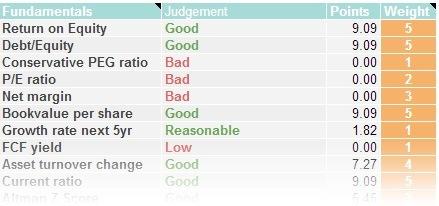
Well, each line item used to determine the final score, like Return on Equity and Current Ratio, gets assigned a weight. The higher the weight number, the more important that particular factor will be in the final score.
For example, I find it more important that a company has a healthy Debt/Equity ratio than a good PEG ratio, therefore I assign the former a higher weight than the latter. You probably put more emphasis on other factors, so you set their weight accordingly. It's that simple.
If a line item has three possible outcomes, like good, average, or bad, the scores given are 100, 50, or 0 respectively, which is then multiplied with the weight (as a percentage of the total weights set). The result of this calculation, as shown in the Points column, is the amount of points that this particular line item will add to the total score.
I don't blame you if this explanation makes no sense to you at all. It is sufficient to know that if you want to increase the importance of an item in the calculation of the total score you increase the weight of that item, if you want to decrease the importance you decrease the weight, and if you want to completely remove an item from the calculation of the total score you simply set its weight to 0.
The default weights are set by me based on my personal Value Investing strategy. This makes them a good starting point for most people, but you are free to adjust them to your liking.
Intrinsic value estimates
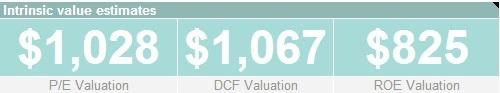
Once you find a company with solid fundamentals, it is time to answer our second question: how much is this company worth?
The spreadsheet uses three distinctive valuation models to estimate the intrinsic, or "true" value of the company*.
Why three models you ask? Well, because all of them require some assumptions to work properly, which is why none of them is perfect. In fact, there is no perfect way to value a company, no matter what some gurus try to make you believe. It is more an art than a science. However, averaging these three valuation models, which offsets the flaws in each individual model, allows you to get a reasonably good approximation of a company's intrinsic value.
Keep in mind that you can get wildly different valuations if you analyze companies with inconsistent earnings, because their value is nearly impossible to predict based on their volatile financial history. If the current share price is below the average value as calculated by the three models, the spreadsheet shows the amount of undervaluation. The same goes for overvaluation.
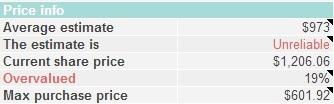
Finally, the Max purchase price is calculated based on your Desired return on investment, which you can set in the Inputs tab. This value is set to a 20% annual return by default, but you are free to change this. In other words, if for example the Max purchase price for Apple is $600, this means that you should only buy Apple at a price of $600 or lower if you want to earn your Desired return on investment in the coming years.
* For an in-depth explanation of these valuation models I recommend you read the free eBook I wrote on the subject.
Conclusion
This detailed tutorial explained the most important part of your Value Spreadsheet, the Dashboard. You learned how to log in, how to enter a company to analyze, how to use the Score to quickly determine whether or not a company is performing well, and how to assess whether a company is currently over- or undervalued. This is crucial information in you quest to beat the market consistently.
If you still have questions after reading this, don't hesitate to send me an email at

FREE SPREADSHEETS & EBOOK
Get three powerful automated spreadsheets, including an intrinsic value spreadsheet + my ebook "The 10 Best Investors in the World", for free!