
If you invest in stocks, you need to know how to analyze financial statements of a company, or you're simply gambling with your money.
In order to figure out whether you're dealing with an exceptional company or a turd in disguise, you need to know how much a business makes, how much it spends, what it owns, and what it owes.
Financial statements -the Income Statement, Balance Sheet, and Cash Flow Statement - can tell you this crucial information, and in this article you will learn exactly how to analyze each of them, in a step-by-step fashion.
It's not rocket science.
If you can read and you've made it through fourth grade math, you're good to go!
There are just a couple of tricky terms that you will need to familiarize yourself with, but I'll help you out with that.
A brief, non-boring introduction to accounting
What is the most boring, dusty profession you can think of?
Many of you probably think of accountants.
And yes, the day-to-day bookkeeping activities can be mind-numbingly boring, but the end result, the financial statements, are like a work of art.
At a glance, they show us how well a business is performing, how deeply they are in debt, and what their inventory is worth, to name just a few things.
Financial statements offer us a look behind the scenes, and they are the single best way for an investor to determine if the stock of a company is worth buying or not.
The great thing is that they are, to a large extent, standardized according to the so called Generally Accepted Accounting Principles, or GAAP for short.
These rules tell accountants what to measure, as well as when and how to record them.
One of the key rules of accounting has to do with "revenue recognition".
When can you record a sale?
Well, if you order a book today from Amazon today, they are only allowed to add the value of this sale to their financial statements once the book has actually been delivered, even though you have already paid for it!
That is why Elon Musk from Tesla Motors (TSLA) sometimes pushes its logistical partners at the end of a quarter to deliver as many vehicles as possible, as cars in transit don't count as revenue, as you can read in this leaked email:
For many reasons, a great deal of Tesla execution worldwide is packed into the final week of the quarter. It is very important that we go all out through end of June 30 to ensure a good outcome. Wouldn’t bring this up if not very important.
Thanks Elon
Also, assets are usually recorded at their original purchase price, even though a building could have significantly appreciated in value over time, greatly understating the real value of a company's assets.
I won't go into too much detail here, but suffice to say that there are accounting rules, but as you saw in the examples above, they are not 100% flawless.
Still, they are the best we got, so let's roll with it, while keeping this in mind during our financial statement analysis.
But first: where do we find these mythical financial statements?!
Where to find a company's financial statements?
Publicly traded companies in the United States have to file their financial statements with the Securities and Exchange Commission (SEC) every quarter.
So while hundreds of websites will have this data available, the source is always the report filed with the SEC.
You can search for SEC filings here:
https://www.sec.gov/edgar/searchedgar/companysearch.html
There are multiple types of filings, but the ones of interest are:
- 10-Q: Quarterly statements
- 10-K: Annual statements
- 8-K: Mentions events important for shareholders, like acquisitions, bankruptcies, or the appointment of new directors
You'll quickly notice that the user experience of the SEC website is absolutely horrendous, which is why I prefer to use the following websites instead:
We'll cover the three main financial statements and the most important items on there, as well as several powerful financial ratios to analyze how well the business is performing.
Let's start by looking at the Income Statement, and what it can teach us.
We'll use Facebook (FB) as an example (click the link to the left, or go to https://finance.yahoo.com and look up Facebook's Income Statements to follow along)
Income Statement Analysis

The Income Statement tells us something very important: did the company make a profit?
In the most basic sense, the income statement shows us:
Revenue - Costs = Income
Let's clear up some terminology:
Sales and revenue mean the same thing: the money that comes in from customers, and is often referred to as the "top line" figure, as it is the first item on any Income Statement.
Profits, earnings, and income all mean the same thing: the money that is left over after all costs are deducted from revenue. It is therefore the so called "bottom line" figure.
The numbers on an Income Statement always refer to a certain period, like a quarter or a year.
For example, Facebook's march 2020 quarterly statement shows revenues of $17.737 billion.
This means they sold ~$17 billion worth of ads in just 3 months... pretty crazy!

BUT, that money does not come free.
Facebook has over 48 thousand employees, for example, has a LOT of servers to pay for, and is of course not exempt from taxes either.
I'll explain the most important line items now, from top to bottom.
We see that first cost of revenue, worth $3.459B, is subtracted, which are the total costs of producing and distributing products and services.
Next, $8.385B worth of operating expenses are deducted, which include money spent on marketing, sales, and administrative tasks, as well as a whopping $4.015B on research & development.
This results in the so called operating income, from which we then subtract $959 million of taxes, which is listed as a tax provision, since the taxes have not been paid yet, but a provision for a future tax payment has to be recorded on the Income Statement.
This again shows you how these financial statements are very helpful, but do not necessarily represent the exact real-world situation.
Once taxes are also deducted, we end up with the "bottom line" figure of $4.902B; a very impressive result for just 3 months of work!
This line item is listed on Yahoo Finance as Net Income Common Stockholders.
This is synonymous to profits, earnings, or income.
A bit confusing, huh?
What's also confusing is that this line item is in fact NOT at the "bottom" of the Income Statement, at least not on Yahoo Finance.
The reason is that they decided to add all kinds of other data points there, which you can mostly ignore for now.
The only value that is still interesting is Basic EPS, which stands for "Earnings Per Share".
It is simply the total amount of net income divided by the total number of shares the company has given out.
In the case of Facebook, they had issued 2.851B shares at the time.
So if we divide the $4.902B in net income by 2.851B shares, you end up with an EPS of $1.72 for the quarter.
Now what?
It's nice that you know what the most important line items are on an Income Statement, but what did we actually learn from these numbers?
For starters, we learned Facebook made an almost $5B profit in the quarter, but that by itself is not enough information.
We have to compare these quarterly earnings to the same quarter one year earlier to see if they grew their earnings or not.
Why not just compare it to the previous quarter?
That's because most companies have cyclical earnings, so not all quarters are the same.
For Apple (AAPL) for example, the fourth quarter is always by far the best one, since it includes Black Friday and Christmas, so it would be unfair to compare it to the quarter before.
If you are looking at annual data instead, you can of course just compare it to the previous year.
Facebook's Q1 2019 resulted in net income of $2.429B, so they actually DOUBLED their net income in Q1 2020 compared to the same quarter last year, even though their revenue only increased from ~$15B to $17.7B!!
Now that's valuable information.
Further information can be gleamed by calculating several financial ratios, but we'll talk more about those later.
For now, let's shift our attention to the second main financial statement: the Balance Sheet!
Balance sheet analysis
As opposed to the Income Statement, The Balance Sheet shows you nothing about profitability, and also does not cover a period, but is instead a snapshot of the financial situation of a company on one single day.
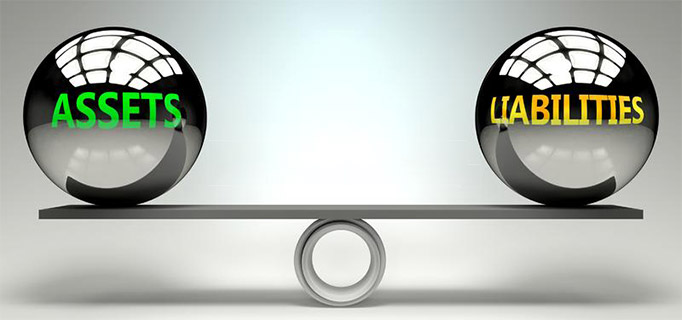
It tells you how much a company owns (Assets), how much they owe (Liabilities), and what they are worth (Shareholders' Equity) on the particular day the Balance Sheet was written.
It is of the utmost importance for an investor, but also for your personal financial situation, to know the difference between Assets and Liabilities, so here is a quick explanation:
Assets are everything a company owns that has value, like cash, real estate, machines, inventory etc.
Liabilities are everything a company owes money on, such as loans, unpaid bills, mortgages etc.
The name stems from the fact that Assets should always equal Liabilities + Shareholders' Equity.
Both sides should be "in balance".
If they are not, then the accountant has missed something :-)
This system makes it harder to "cheat" with the financial figures, as you can't hide any costs, because then things will be out of balance and this will be noticed.
However, when you look up a Balance Sheet on, for example, Yahoo Finance, it will be a list, not a two-sided table, but the idea is the same.
Let's have a look at Facebook's Q1 2020 Balance Sheet, so I can point out some important line items to focus on.
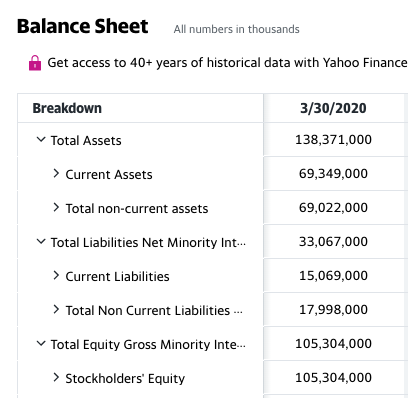
Because a Balance Sheet is a snapshot of a company's financial situation on a specific day, you usually want to look at the latest quarter of data to have the most recent numbers, whereas for an Income Statement you want to add up the latest 4 quarters of data to get the so called Trailing Twelve Months (TTM) data.
Total Assets is divided into current assets and non-current assets.
Current assets include cash and assets that will be converted into cash in less than a year, like inventory and accounts receivable, which is money still owed to the company by its clients.
Non-current assets are things of value that are not for sale, like property, plant, and equipment (that's what the PPE line item stands for on the Balance Sheet), but also intangible assets, like patents, trademarks, and copyrights.
The same goes for Total Liabilities, which is split up into current liabilities, like unpaid bills, and non-current liabilities, like long-term debt.
On the Yahoo Finance page, you see you can expand a lot of these line items, and doing this results in an incredibly long list of line items.
While this is helpful if you are really trying to dig deep into a specific aspect of the business, it can be overwhelming.
Luckily it is usually sufficient to just look at the more top-level entries, like current liabilities, long-term debt, or shareholders' equity.
Shareholders' equity, also called stockholder's equity, net worth, or book value, is an accounting term which technically represents the company's value to its shareholders, but in reality this number is not very accurate due to some of the quirks in the GAAP accounting rules we discussed earlier.
For example, Facebook's shareholders' equity was $105.304B in Q1 2020, but their market cap was closer to $630B.
Financial ratio analysis

Still, we use shareholders' equity in a lot of useful financial ratios, which I might as well discuss now, as we have covered most of the important line items already.
Debt-to-equity ratio
For example, simply seeing that Facebook's long-term debt equalled $9.509B does not tell us much, because while this seems like a huge number, Facebook is also a particularly huge business, so it is not immediately clear just by looking at that number alone if this is high or not.
However, the debt-to-equity ratio can give us a better idea of the amount of debt relative to shareholders' equity.
The debt-to-equity formula is:
long-term debt / shareholders' equity = debt-to-equityFor Facebook that means:
9.509 / 105.304 = 0.09
This is in fact a very good result, as value investors usually prefer businesses with a debt-to-equity ratio < 0.5.
Return on Equity
We also use shareholders' equity to calculate one of Warren Buffett's favorite profitability metrics: the return on equity, or ROE for short.
This time, we look at the amount of net income over the last twelve months relative to shareholders' equity in the most recent quarter.
The return on equity formula is:
net income / shareholders' equity = return on equityFor Facebook, this results in:
20,958 / 105.304 = 0.20 = 20%
Another great result, as we are looking for businesses which display consistently high profitability, and a return of equity > 15% is considered high.
Just make sure that this is achieved consistently, so check the ROE of previous years as well.
Current ratio
Another powerful financial ratio used in financial statement analysis is the current ratio, which tells us if a company is able to meet its short term obligations.
It uses the current assets and current liabilities line items from the Balance Sheet.
The current ratio formula is:
current assets / current liabilities = current ratio
Facebook's current ratio is:
69.349 / 15.069 = 4.6
So Facebook had 4.6 times more current assets than current liabilities, which means it can very easily pay for its short term financial obligations.
A healthy current ratio is > 2.
Other financial ratios
There are numerous other financial ratios, but more data = more confusion.
Also, more data often increases confidence, without necessarily increasing accuracy.
So in my experience, just stick to the three ratios I mentioned above, especially if you are just starting out with investing, and you will do very well for yourself.
Cash flow statement analysis

After a very welcome diversion, we will now dive into the final statement: the cash flow statement.
It is one of the more easy to understand statements, as it simply tracks how much cash comes in, and how much cash is spent during a period.
This might seem similar to the Income Statement, but it is NOT.
A company can buy and receive inventory, but not pay for it yet.
This means that the Income Statement (Cost of Revenue) and the Balance Sheet (Inventory) are affected, but since no cash has changed hands yet, the Cash Flow Statement remains unchanged for now.
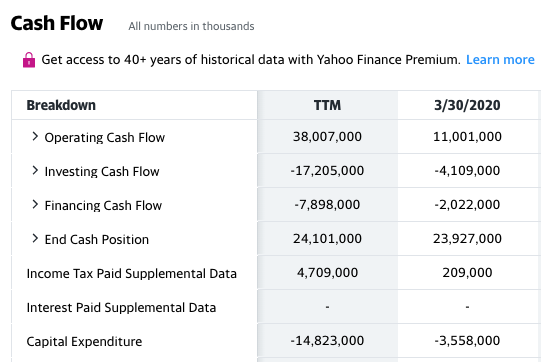
When we look at Facebook's Q1 2020 Cash Flow Statement, we see three major line items:
- Cash flows from operating activities
Cash transactions for day-to-day business activities, like receiving payments from customers, and paying suppliers and employees - Cash flows from financing activities
Cash received from selling stocks or borrowing money, as well as cash used to pay interest on loans or dividends to shareholders - Cash flows from investing activities
Cash invested in property, plant & equipment (PPE)
Cash flow is an important term to understand here.
A positive cash flow means that the company has more cash at the end of the period than at the beginning, while a negative cash flow means they have less cash at the end than at the beginning of the period.
Due to the sometimes strange GAAP accounting rules, a company can actually report a profit on the Income Statement, while they are in fact having a negative cash flow, which could ultimately lead them to run out of cash and being unable to pay their bills.
This is what happened with the scandals around companies like Enron and WorldCom: they seemed to make a profit, but were actually running out of cash.
Cash is harder to "fake" than income, which is why the Cash Flow Statement is so important, and why you should always check if free cash flow is higher than net income to make sure they are not "cooking the books".
Free cash flow is the cash that can be taken out of a business, without disrupting its day-to-day operations.
The free cash flow formula is (all TTM):
cash flows from operating activities - capital expenditures = free cash flow
Capital expenditures are investments made to grow the business (as well as to maintain existing assets), so if we subtract them from the cash generated by the daily operations of the company, we are left with the cash that we can take out of the business without disrupting it.
On Yahoo Finance, capital expenditures are actually listed as investments in property, plant and equipment under cash flows from investing activities (really annoying how they keep using different words for the same thing, right?).
For Facebook, this ends up being:
38.007 - 14.823 = $23.184B
We can now use this free cash flow figure to see if a company is 1) generating excess cash, 2) not misrepresenting their earnings, and 3) to estimate the intrinsic value of a company using a Discounted Cash Flow model.
Financial statement analysis is doable
Hopefully, this article gave you some insight into the three financial statements, and what to look for in each of them.
My goal was to focus your attention on the most important figures, while ignoring the rest (for now), as this mountain of information can easily distract and overwhelm the novice investor.
If you love financial statements by now and want to dive deeper into the material, I can recommend the book Financial Statements: A Step-by-Step Guide to Understanding and Creating Financial Reports by Thomas Ittelson.
However, if you're like me and you are not stoked about the prospect of manually combing through the financial statements of hundreds of companies and calculating all these ratios using your calculator, then you might be interested in the powerful stock analysis spreadsheet I developed, which performs all these financial statement analyses, as well as intrinsic value calculations, fully automatically.
All you have to do is fill in a ticker symbol :-)


FREE SPREADSHEETS & EBOOK
Get three powerful automated spreadsheets, including an intrinsic value spreadsheet + my ebook "The 10 Best Investors in the World", for free!