
When it comes to long-term investing, it is important that you are capable of performing an in-depth fundamental analysis of a company's financial statements to determine if a stock is a good buy or not.
And trust me, it took me a looong time to figure out how to do that correctly, and then even longer to find software to help me make this process easier.
In this article, I will briefly describe what fundamental analysis is, why it is important for investors, and features that the best stock analysis software for long-term investors needs to have.
What is fundamental analysis?
Fundamental analysis is the analysis of a company's financial statements in order to determine:
- How well is the business performing?
- How much is the business worth?
These are the two key questions any investor needs to answer before buying a stock.
Technical analysis, on the other hand, looks at charts and tries to predict short-term stock price movements based on historical stock prices.
However, this completely neglects the actual business performance of the underlying company, which is ultimately what drives stock prices in the long-run.
Like Benjamin Graham, Warren Buffett's mentor, once said:
In the short run, the market is a voting machine but in the long run, it is a weighing machine.
Why fundamental stock analysis is important for investors
Fundamental stock analysis is important if you want to minimize downside risk, while maximizing upside potential.
By analyzing a company's financial statements, you can identify if a company has...
- Above-average profitability
- Manageable debt levels
- Low likelihood of going bankrupt
- Growing or declining margins
- And much more
It also helps you calculate the intrinsic value of the company, which you can then compare to its stock price to know if a stock is currently cheap or not.
This allows you to know exactly when to buy stocks and when to sell stocks.
What to look for in stock analysis software?

There are a lot of companies out there offering stock analysis software, so it is important that you know what to look for.
Here is a list of things that the best stock analysis software needs to be able to do:
- Analyze multiple years of financial statement data
- Analyze key financial ratios
- Show trends for the most important indicators
- Calculate intrinsic value using multiple models
- Allow customization
- Show the formulas behind the calculations
- Be easy to use and not overwhelm the user
Sounds reasonable, right?
Now, you will find that most stock analysis software will NOT meet all of those criteria.
Some will be focused on technical analysis, some will not calculate the intrinsic value (very important!), and most will completely overwhelm the user with stats and figures while not showing how these numbers have been calculated.
And the worst part is, they will charge you thousands of dollars per year for using their services.
So let me tell you a little about the fundamental analysis software I use.
Best stock analysis software (for me personally)
When I started investing, I was still a teenager and my parents had to sign a consent form for me to even be allowed to open a brokerage account at all!
Needless to say, I had no clue what I was doing, and quickly lost half of my savings.
I then started researching how the best investors in the world consistently made great returns from investing in stocks, and found out about Warren Buffett and his value investing strategy.
Value investors aim to buy great companies when they are on sale.
So how do you identify a great company?
And how do you know when they are on sale?
This, like I mentioned before, is done through fundamental analysis and intrinsic value calculations.
Now, these things can get complicated quite quickly, so I started looking into software to help me out with this.
However, they all were prohibitively expensive, overwhelming, and not very transparent or customizable.
That's when I decided to build my own spreadsheets to perform the necessary calculations.
This way I had total control over the formulas, and it allowed me to customize them to my exact needs.
At some point I was using 9 different spreadsheets, and they all required me to manually input the financial data.
This worked, but it took me a LONG time to analyze a single stock.
I also made errors filling in the data, causing me to lose money by buying a stock that only looked good because I typed a 0 too many.
That's when I vowed to create "one spreadsheet to rule them all".
All this turned into my Value Spreadsheet stock analysis software, which can analyze stocks in seconds and calculate their intrinsic value, fully automatically, simply by filling in a ticker symbol!
Sounds pretty good, right?
This is the stock analysis software I personally use to consistently pick winning stocks and earn ~20% per year.
Only years later, after reading The 4-Hour Workweek by Tim Ferriss, did I decide to make this spreadsheet publicly available to investors like yourself.
Conclusion
With the help of stock analysis software, you are able to analyze stocks quickly, thoroughly, and rationally.
I highly recommend you use some sort of tool to help you speed up your stock picking process, because pen and paper will unfortunately not cut it, as there are thousands of stocks out there.
You can either take the same route as me, and build your own spreadsheet, or purchase one of the existing tools out there.
I would be stoked if you gave my spreadsheet a try for 30 days, as you can get all of your money back within that period, no questions asked.
Learn More About Value Spreadsheet...

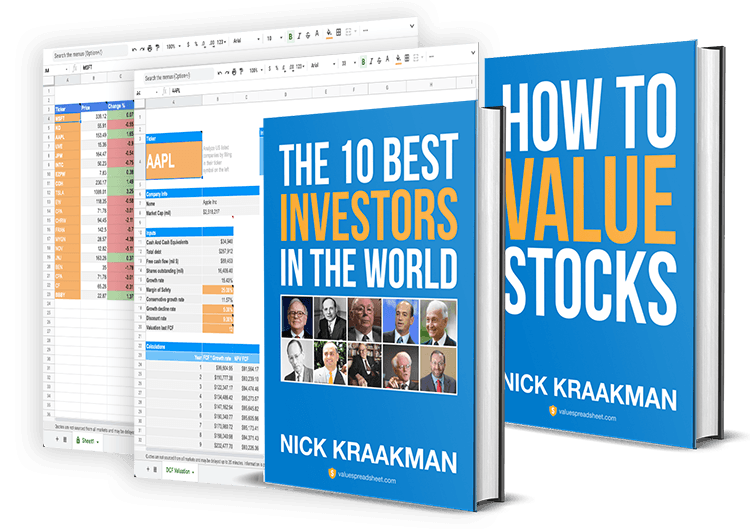

FREE SPREADSHEETS & EBOOK
Get three powerful automated spreadsheets, including an intrinsic value spreadsheet + my ebook "The 10 Best Investors in the World", for free!